S&P500 Dividend Theory
Retirees can gain confidence by examining the history of S&P500 dividends. Dividend strategies are safe and sound. The downside risk is a temporary income drop less than 10% (nominal).
Dividend Growth
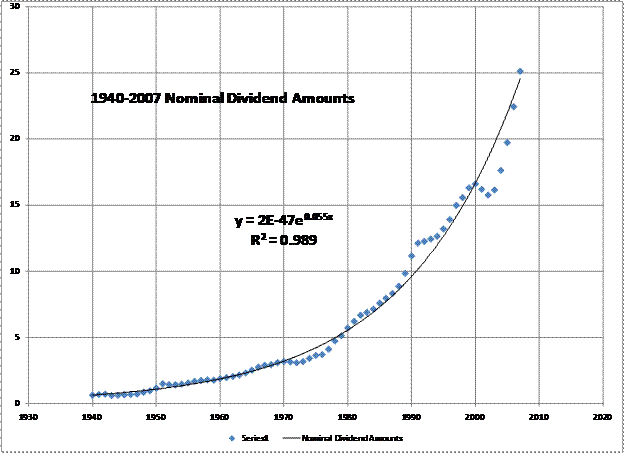
S&P500 dividends have grown steadily since 1940.
The regression equation for steady percentage growth is exponential. An exponential curve fit of the dividend amount has the equation:
Dividend amount = 2E-47*exp(0.055*Year) with R-squared=0.989.
Taking the ratio of balances at any two years:
The final dividend amount/the initial dividend amount=exp(0.055*number of years).
The annualized rate of return is (1+rate)^(number of years).
Since 0.055 is small, the rate of growth is almost exactly the exponential value 0.055.
S&P500 dividends have grown almost exactly 5.5% per year (nominal, annualized) since 1940.

Dividend Shortfalls
Here is a list of Declines in the Nominal Dividend Amount since 1940:
1941.12 0.71
1942.12 0.59
Drop to 83%
1941.12 E=1.16 and single year payout ratio=46%.
1951.06 1.56
1952.12 1.41
Drop to 90%
1951.06 E=2.72 and single year payout ratio=57%.
1956.09 1.84
1958.06 1.73
Drop to 94%
1956.09 E=3.46 and single year payout ratio=53%.
1970.09 3.19
1972.07 3.07
Drop to 96%
1970.09 E=5.36 and single year payout ratio=60%.
2000.03 16.76
2001.06 15.69
Drop to 94%
2000.03 E=50.94 and single year payout ratio=33%.
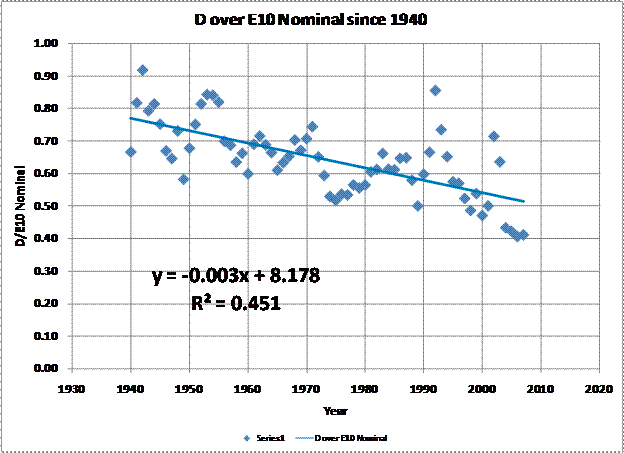
The single year payout ratio makes a poor predictor. However, using a payout ratio based on ten years of earnings works well. It shows that the modified payout ratio (D/E10 Nominal) has been declining steadily.
The regression equation for D/E10 since 1940 is y=-0.003x+8.178 with R-squared=0.451. The confidence limits are plus and minus 12%.
In 1940, the regression line was at a 77% level. In 2007 it had fallen to 51%. The actual value of D/E10 in 2007 was 41%.
From this, it is clear that dividend safety has improved steadily. A dividend cut as high as 10% would be quite unusual at today’s low payout ratio.

Implications for Dividend Investors
Today’s S&P500 has quite a few stocks yielding 4% and above. If you were to exclude low dividend payers and non dividend payers, you would have well over 100 stocks to choose from. Many of these stocks are from high quality companies. To an excellent approximation, such a portfolio would grow its dividend amount as fast as the S&P500 overall or even faster.
You should be able to construct a highly diversified portfolio with an initial dividend yield above 4% that grows its dividend amount at least as fast as 5.5% per year (nominal). The worst case dividend drop from such a portfolio, looking forward, should be less than 10%.
Even with this simple portfolio, you should be able to withdraw more than 4% of your original balance initially. Your income should grow at least as fast as inflation. You have a cushion. Inflation averages around 3% to 4%. You would never sell shares for income. You would occasionally sell shares to maintain or improve dividend quality.
With care, you should be able to do better. There are many alternatives. One approach is direct income investing. Another is the dividend blend. My favorite is the delayed purchase approach, which is the individual stock equivalent of Valuation Informed Indexing.
Have fun.
John Walter Russell
August 11, 2008
|

