|
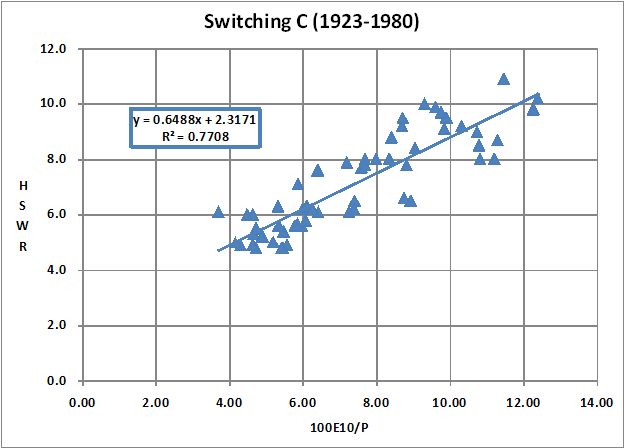
Switching CI optimized stock allocation switching for today’s valuations on the Investment Strategy Tester. I call this Switching C. I have now generated 30-year Historical Surviving Withdrawal Rates for sequences starting in 1923-1980. SettingsThe P/E10 thresholds for Switching C are 10-18-30. The stock allocations are 100-80-20-0% respectively. That is, the stock allocation is 100% when P/E10 is below 10. It is 80% when P/E10 is between 10 and 18. And so forth. GraphThis picture shows the 30-year Historical Surviving Withdrawal Rates HSWR of Switching C starting from 1923-1980. 
ObservationThe Investment Strategy Tester has expanded our ability to optimize Valuation Informed Indexing settings. It allows us to look at mid-range and favorable valuations. Previous procedures were limited to starting at high valuations. |